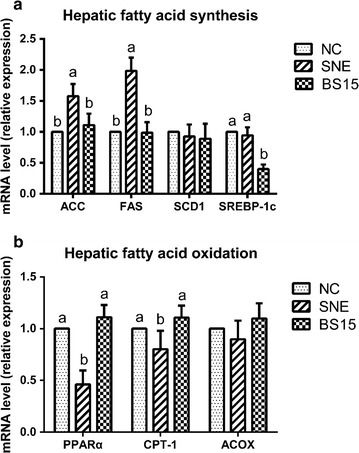
Fig. 3.

The relative mRNA expressions of lipid metabolism related enzymes in liver. Means in the same row with no superscripts or with a common superscript letter do not differ significantly (P < 0.05). Data are presented with the mean ± standard deviation (for six replicates of one chick per cage). a, b The relative expression of ACC, FAS, SCD1, SREBP-1c, PPARα, CPT-1 and ACOX, respectively
