Figure 2.

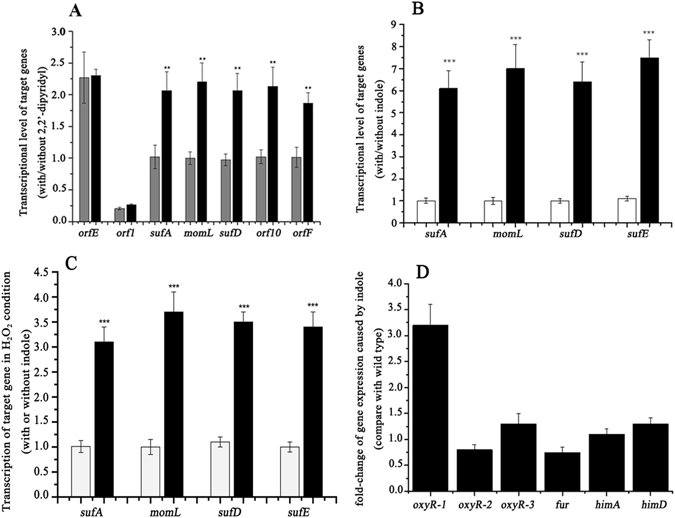
The transcriptional analysis (Ct values) of related genes. (A) Transcription levels of genes in the suf-momL operon with (black) or without (gray) the iron-chelating agent 2,2′-dipyridyl. (B) Transcription levels of suf-momL genes in iron-deficient condition with (black) or without indole (transparent). (C) indole-induced transcriptional change in H2O2 condition (black, with indole; transparent, without indole). (D) The effects of indole on a series of suf regulators. Error bars represent the standard deviations of three replicates. For statistical analysis, ***/**/* means P < 0.001, P < 0.01, and P < 0.05, respectively.
