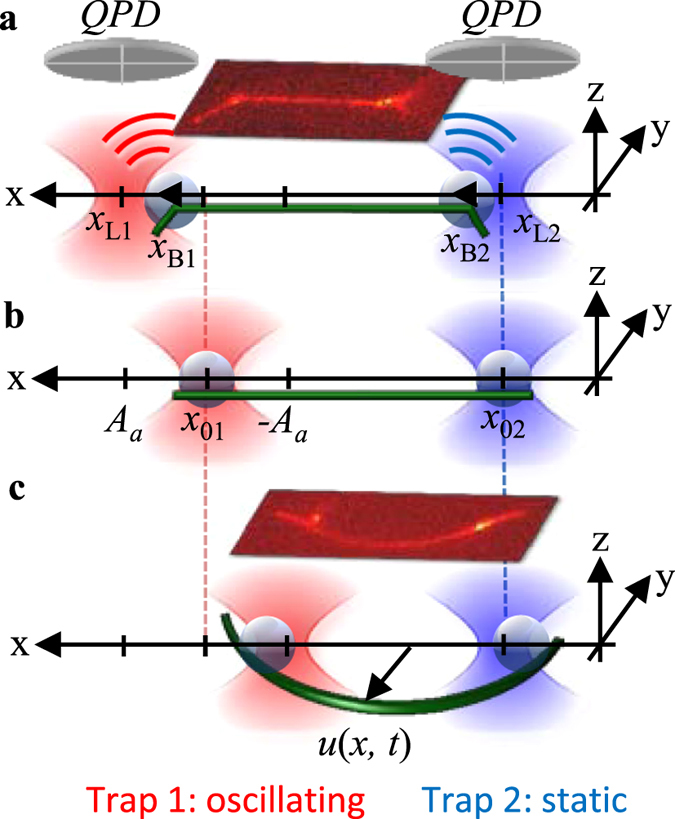
Figure 1.

Design of experiment illustrating different stages of an oscillation period. Optically trapped d = 1.06 µm Neutravidin-coated beads are used as anchors points for laterally attached, biotinylated microtubules. Bead positions are tracked interferometrically by QPDs. (a) The filament is stretched during the first half oscillation period. (b) The filament is straight after each half period. (c) The filament is buckled during the second half oscillation period. Insets: overlay of corresponding fluorescence and brightfield images.
