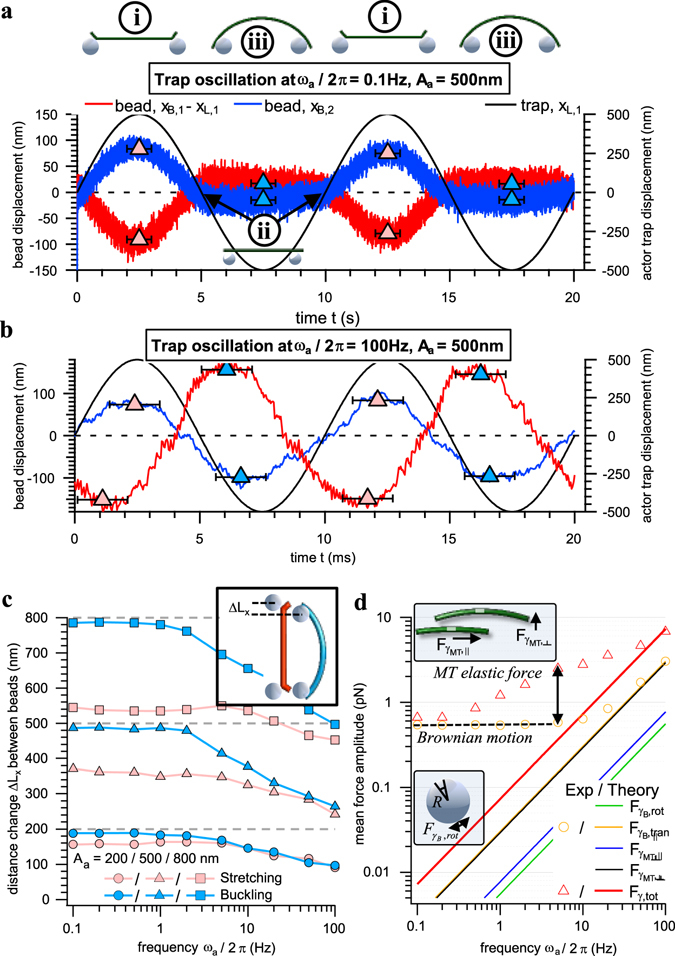
Figure 2.

Frequency dependent response of a single microtubule filament – bead construct (L = 5 µm). (a) and (b) Two periods of the relative actor and sensor bead displacements x B1(t) − x L1(t) and x B2(t) − x L2(t) from their trap centers during oscillations of the actor trap x L1(t) = L/2 + A asin(ω a t) and the static sensor trap x L2(t) = −L/2 at A a = 500 nm and ω a/2π = 0.1 Hz (a), or ω a/2π = 100 Hz (b), respectively. Markers indicate the maximum amplitude x max1 and x max2 of both beads during each half period. (c) Frequency dependence of the maximum amplitude ΔL x = A a − x max1 − x max2 between both beads during stretching and buckling averaged over several oscillation periods. (d) Theoretical mean amplitudes of the involved viscous forces (solid lines) compared to the experimentally obtained sum of all acting forces (markers) for a single trapped bead (yellow) and the filament – bead construct (red).
