
Figure 5.
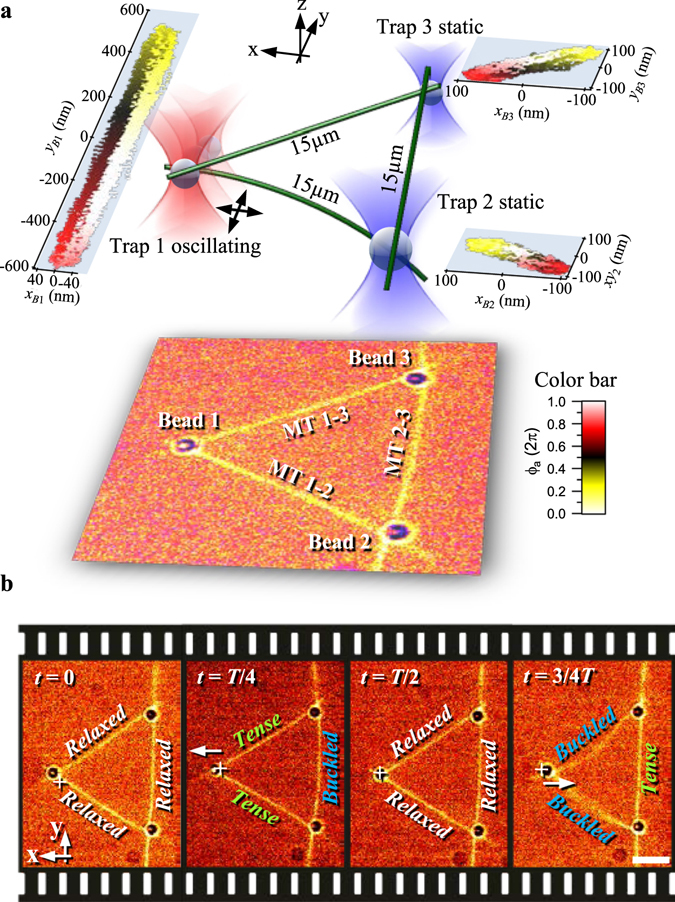
Probing an equilateral triangular network of GMPCPP filaments. (a) Design of experiment in pseudo 3D with overlay of fluorescence and brightfield image (bottom). Scatterplots of absolute bead positions during a tangential oscillation in y direction are shown color coded over the current phase ϕ a of the actor trap. (b) Overlay of fluorescence and brightfield images of the characteristic time points during one radial (x) oscillation period at f a = 0.1 Hz. Scale bar: 5 µm.