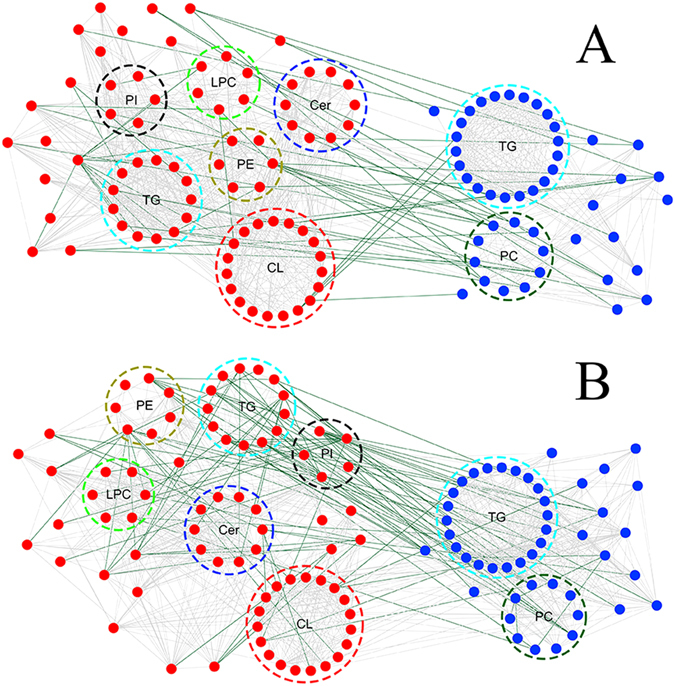
Figure 4.

A correlation network of commonly altered lipid classes both within and across LVTA myocardial and serum specimens. Highly correlated lipid species were connected with lines (lipid species were included if they had correlation coefficients >0.6). The dark green and light grey lines represent positive and negative correlations, respectively. The red and blue dots represent lipids in myocardia and sera, respectively. (A) ACO-LVTA model; (B) CAL-LVTA model; CL: cardiolipin, Cer: ceramide, PE: phosphatidylethanolamine, PI: phosphatidylinositol, TG: triacylglycerol, LPC: lyso-phosphatidylcholine, TG: triacylglycerol, PC: phosphatidylcholine.
