
Figure 5.
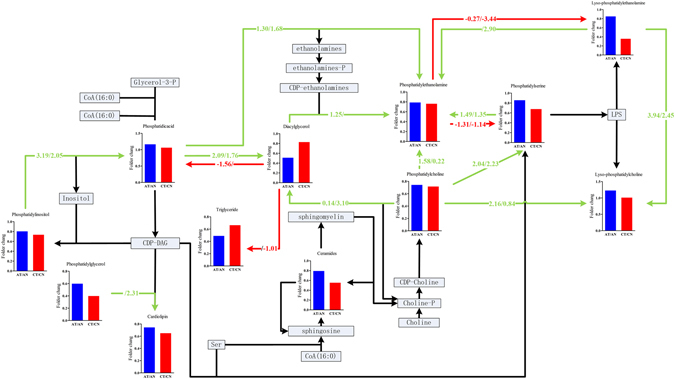
Lipid pathways that were involved in the LVTA models. Fold changes were determined by comparing ratios of the sums of the differential lipid species within a lipid class between LVTA and controls myocardia specimens. The values on each axis denoted Z-scores, calculated by Z = CDF −1 (1 − P), where CDF were the cumulative distribution function. P-values were calculated using student’s t-test between LVTA models and controls and determined the weight of each reaction (each axis). Green lines indicated that the amount of product was greater than the reactant; red lines had the opposite meaning. Z-values above slashes were from Model I, while those under slashes were from Model II; Z-values greater than 1.645 suggested that a pathway was active.