Figure 6.

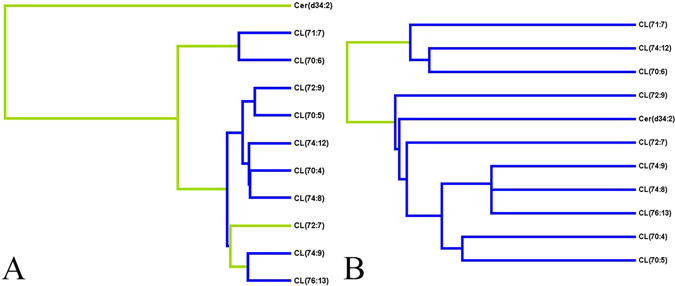
Potential biomarkers common to two LVTA models and their diagnostic potentials. (A,B) This figure gives HCA graph of 11 lipid species that were altered in both models, (A and B represent Models I and II, respectively).

Potential biomarkers common to two LVTA models and their diagnostic potentials. (A,B) This figure gives HCA graph of 11 lipid species that were altered in both models, (A and B represent Models I and II, respectively).