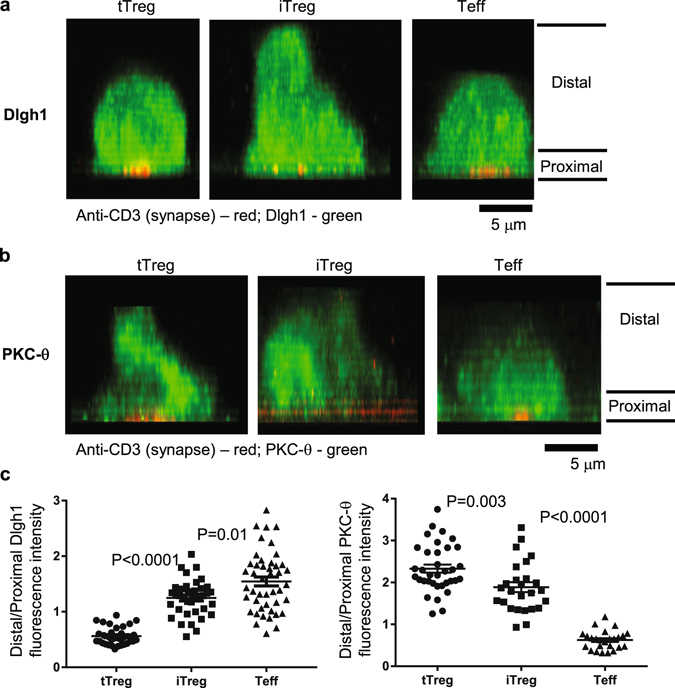
Figure 2.

Side view of Dlgh1 and PKC-θ intracellular distribution in tTreg, iTreg and Teffs. The cells were activated using lipid bilayers as mentioned above, for 10 min at 37 °C, fixed and processed for Dlgh1 and PKC-θ immunofluorescence. Cells were imaged using line scanning confocal microscope, and images were 3D projected to reveal intracellular distribution of aforementioned proteins. Anti-CD3 (pseudocolored red) marks synaptic and proximal areas, while the proteins have been pseudocolored green. Note the enriched distribution of Dlgh1 at the proximal and of PKC-θ towards distal side in tTreg (left panels), and a reduction of this distribution in iTreg (middle panels). The panels show representative images. Dlgh1 and PKC-θ staining was quantified by calculation of average fluorescence intensity in cells. Data are representative of two different experiments. P values were calculated using Mann-Whitney test.
