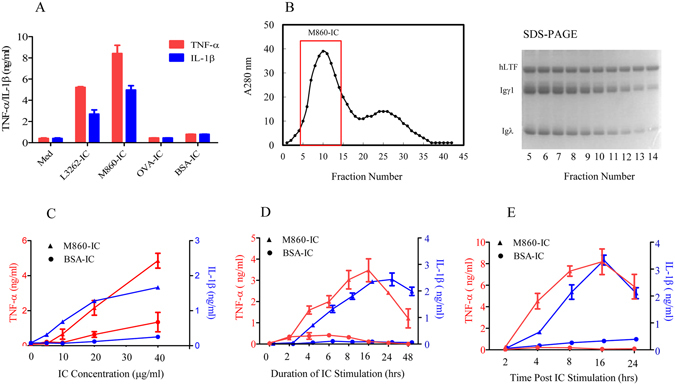
Figure 3.

Functional comparison between LTF-ICs and control ICs. (A) Freshly fractionated human monocytes were stimulated with or without (Med) 15 μg/ml equal proportion mixtures of huLTF plus L3262 (LTF-IC), or huLTF plus mAb M860 (M860-IC), or OVA plus mAb M562 (OVA-IC), or BSA plus mAb J1 (BSA-IC) for 18 h. (B) For preparation of preformed M860-IC, 10 mg/ml of huLTF and M860 were mixed overnight and then fractionated using a Sephadex column, monitoring the fractions by spectrometry at 280 nm (histogram on the left). Guided by SDS-PAGE 10% gel electrophoresis results of the elution samples (image on the right), fractions 5–14 of the first peak were harvested and combined. (C) Human monocytes were stimulated with either increasing concentrations (5, 10, 20, 40 μg/ml) of preformed M860-IC, or preformed BSA-IC, for 18 h, or (D) with 30 μg/ml preformed M860-IC or BSA-IC for various length of time up to 48 h, or (E) with 30 μg/ml preformed M860-IC or BSA-IC for 1 h, washed and then cultured in fresh medium for various length of time up to 24 h. TNF-α (red lines or bars) and IL-1β (blue lines or bars) levels in culture supernatants were measured by ELISAs. Values are the mean concentration (ng/ml) ± SEM from triplicate cultures. Results are representatives of experiments performed at least three times.
