Figure 1.

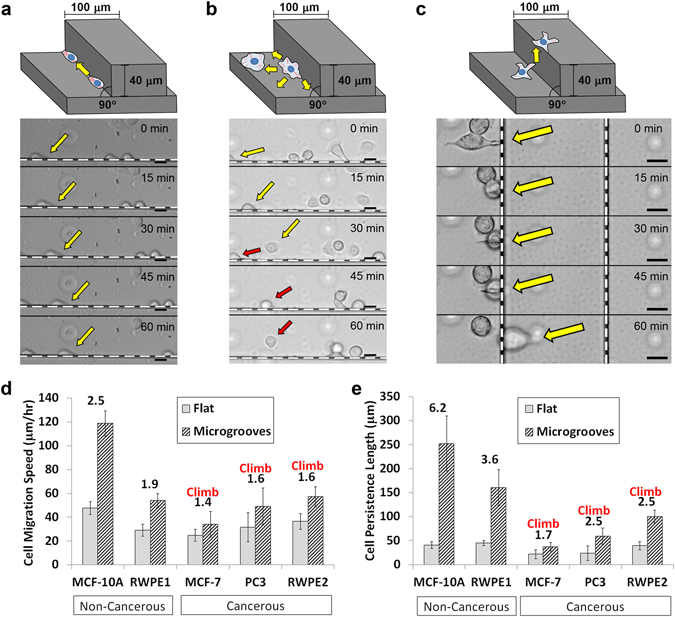
Schematic illustrations of the different modes of cell migration on the PDMS microgroove structures and time-lapse images of (a) RWPE1 (non-cancerous; persistent) and (b) RWPE2 (cancerous; non-persistent) cell migration along the groove walls (the dotted white lines in each image), as well as (c) PC3 (cancerous) cell climbing over the walls. Colored arrows point to notable cells in each image. (Scale bar, 20 μm) (d) Speed and (e) persistence length measurements of various non-cancerous and cancerous epithelial cell types on the flat surfaces and at the corners of the microgrooves. Numbers above the bars represent the quantitative effect of topography as the ratio between the groove and flat measurements. “Climb” signifies that the cell type could climb over 40-µm-high walls. Error bars are SEM (N = 5 trials with 10–20 cells quantified per trial).
