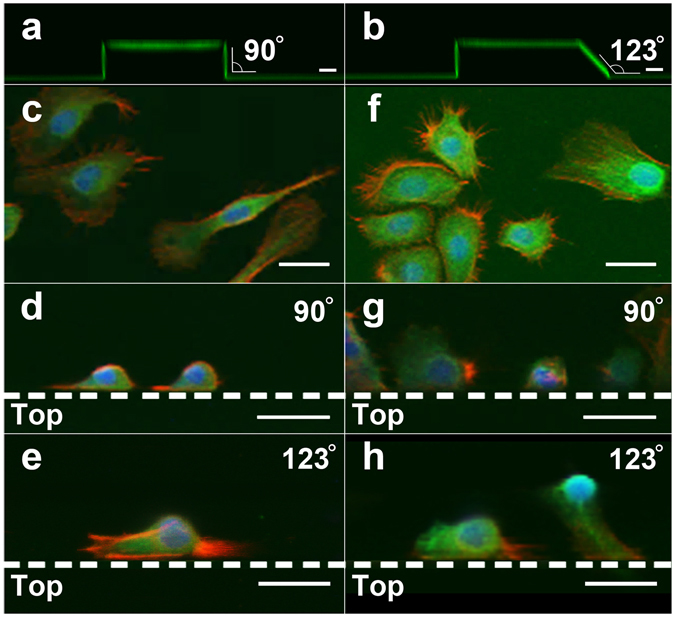
Figure 2.

Confocal image of the microgroove-based structures with (a) 90° wall and (b) 123° wall visualized by the adsorbed FITC-BSA. Immunostaining (20x) of actin (red), vinculin (green) and nucleus (blue) of (c–e) RWPE1 (non-cancerous; polarized) and (f–h) RWPE2 (cancerous; non-polarized) cells on (c,f) flat surfaces, (d,g) upright microgroove structures and (e,h) slanted microgroove structures. Dotted lines represent the microgroove wall boundaries, and the ‘Top’ area below the lines represent the top plateau of the microgroove structures. (Scale bar, 20 μm).
