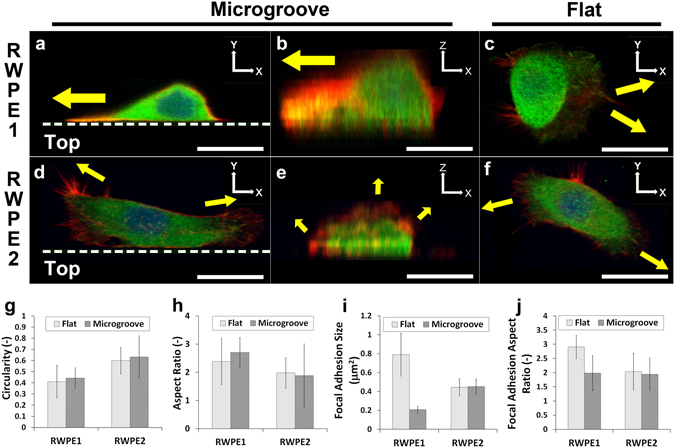
Figure 3.

Immunostaining (63x) of actin (red), vinculin (green) and nucleus (blue) of (a–c) RWPE1 (non-cancerous; polarized) and (d–f) RWPE2 (cancerous; non-polarized) cells on (c,f) flat surfaces and on microgroove structures, with the same cell visualized on (a,d) the X-Y plane and (b,e) the Z-X plane. Dotted lines represent the microgroove wall boundaries, and the ‘Top’ area below the lines represent the top plateau of the microgroove structures. Yellow arrows indicate the directions of the major actin extensions. (Scale bar, 20 μm) (g) Circularity and (h) aspect ratio for RWPE1 and RWPE2 cells on flat surfaces and microgroove structures. (i) Focal adhesion size and (j) focal adhesion aspect ratio for RWPE1 and RWPE2 cells on flat surfaces and microgroove structures. Error bars are SEM (N = 3 trials with 20 cells quantified per trial).
