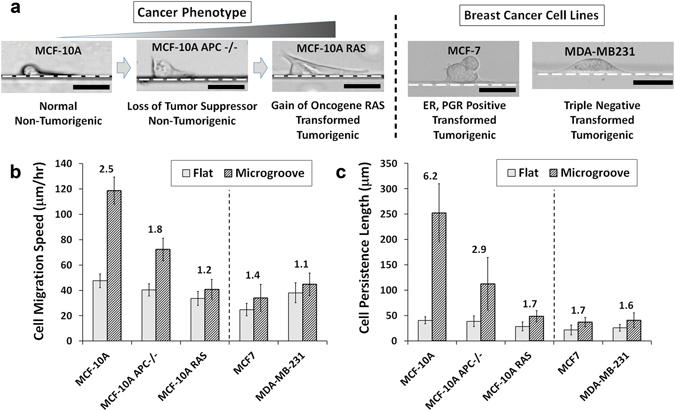
Figure 4.

(a) Bright-field images of the disruption in the stable morphology with genetic alterations to the MCF-10A cells and morphologies of other breast tumor cell lines at the corners of the microgroove structures. Dotted lines represent the microgroove wall boundaries. (Scale bar, 20 μm) (b) Speed and (c) persistence length measurements of MCF-10A variants and other breast tumor cell lines on the flat surfaces and at the corners of the microgrooves. Numbers above the bars represent the quantitative effect of topography as the ratio between the groove and flat measurements. Error bars are SEM (N = 5 trials with 10–20 cells quantified per trial).
