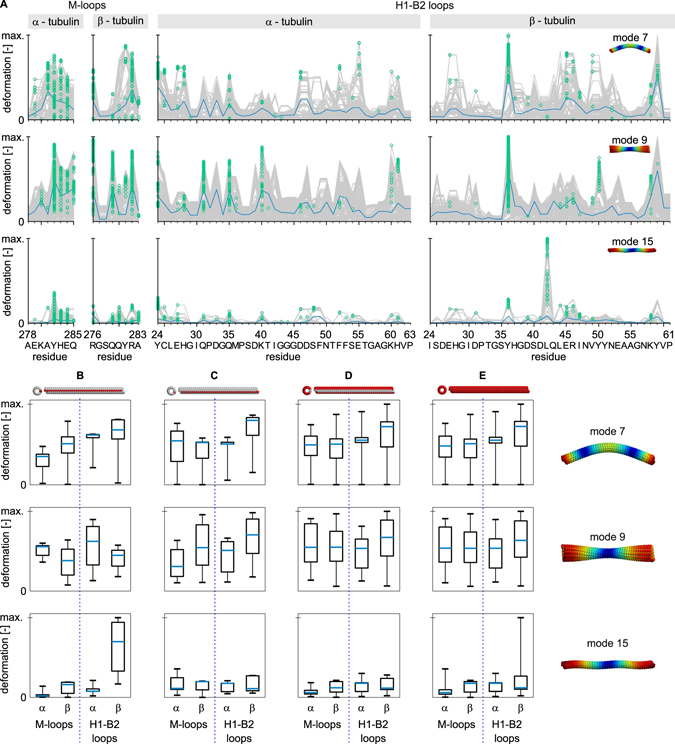
Figure 5.

Deformation in lateral contacts for three principal shapes of normal modes. (A) absolute vibration-related deformations along residues forming the M-loop and H1-B2 loop within α and β tubulins. Absolute deformations for all tubulin dimers within microtubule (grey) with individual maxima used for box-plots bellow marked by green circles. The blue line shows the average of the absolute value of the deformation. Deformations in M-loops and H1-B2 loops in tubulins in the seam (B,C) and far from the seam (D) of the microtubule. Overall deformations in these regions are shown in column (E). The analyzed protofilaments are indicated in red above each column. The central blue mark in box-plots represents the median, the box represents a region within the 25th and 75th percentiles, and the whiskers represent the maximum extent of absolute deformation. Note that the deformations are normalized to the maximum within the respective vibration mode and that the number of tubulins within the seam is smaller than the number of tubulins not involved in the seam.
