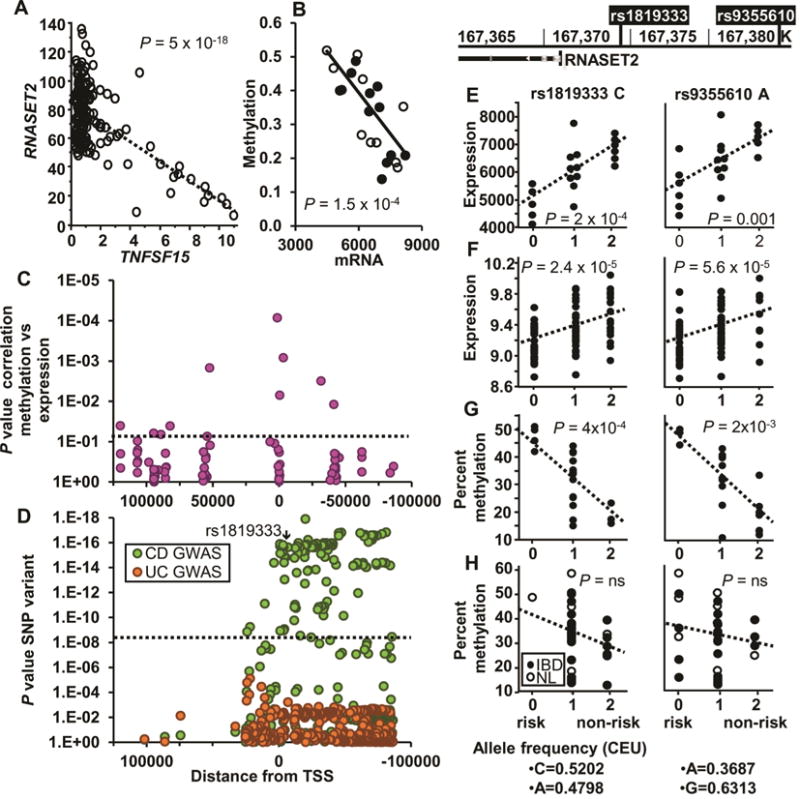
Fig. 2.

Correlation of RNASET2 and associated SNPs on expression and methylation. (A) Correlation of RNASET2 and TNFSF15 expression in CD3+ peripheral T cells from 138 CD patients requiring surgical intervention for disease management, using RNA-seq. (B) Correlation of RNASET2 expression and methylation (cg25258033, located 1.4 kb within the first intron) in 21 IBD patients. (C) Correlation of methylation and expression located within 100 kb of the RNASET2 TSS for 21 IBD patients. (D) GWAS p values for the same RNASET2 region based upon data from 18729 CD, 14331 UC and 34897 controls. (E–F) eQTL of RNASET2 SNPs (rs1819333 and rs9355610) from (E) CD3+ peripheral T cells from 11 CD and 10 UC patients requiring surgical intervention for disease management, using an Illumina expression array or (F) Ileal surgical resections of 85 CD patients using an Agilent expression array. (G–H) mQTL (cg25258033) of CD3+ peripheral T cells from (G) 20 CD patients requiring surgical intervention for disease management or (H) 16 CD patients who were responsive to IBD therapeutics and 9 normal controls.
