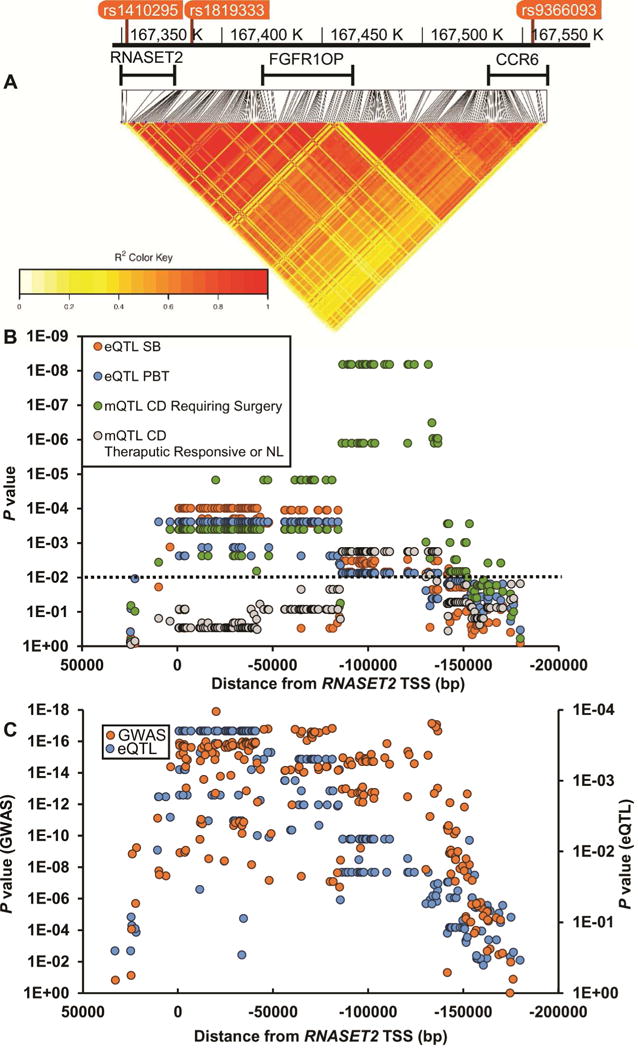
Fig. 3.

Mapping of eQTL and mQTL across the RNASET2 locus. (A) Heatmap illustrating pairwise LD (measured by the squared allelic correlation coefficient r2) for 210 SNPs around RNASET2 TSS. Boundaries of region examined are defined by rs1410295 and rs9366096. (B) eQTL and mQTL were calculated using CD3+ T cells from both the peripheral and mucosal compartments from patients requiring surgical intervention for disease management compared to those who were responsive to IBD therapeutics or normal controls. (C) Correlation of GWAS p values with eQTL p values over the RNASET2 locus. GWAS values are based upon data from 18729 CD and 34897 controls and eQTL based upon data for 71 CD patients requiring surgical intervention for disease management.
