Figure 1.
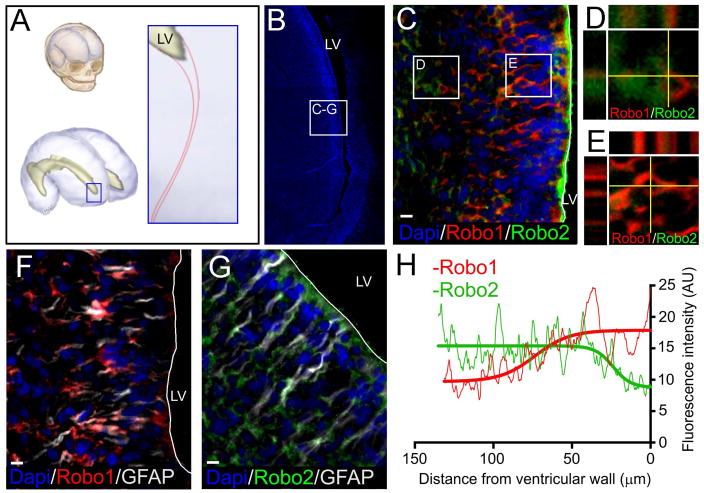
Expression of Robo1 and Robo2 in human fetal SVZ at the LGE. A, Schematic representation of the area studied at the anterior horn of the lateral ventricle in the human fetal brain. B, Dapi stained image showing the anterior extension of the lateral ventricle and the area observed in the following frames. C-E, Co-staining of Robo1 and Robo2 isoforms shows that while Robo1 appears closer to the ventricular wall, Robo2 appears deeper into the parenchyma. F, Robo1 co-staining with GFAP shows expression of Robo1 in areas close to the ventricle where GFAP cells are present. G, Robo2 co-staining with GFAP shows a higher concentration of Robo1 deeper in the parenchyma. H, Fluorescence intensity analysis of Robo1 (red) and Robo2 (green) signals. Graph shows a higher intensity of Robo1 in areas close to the ventricle, which decreases as the distance to the ventricular wall increases. Robo2 signal intensity shows an opposite distribution, showing higher intensity in areas farther from the ventricular wall. Scale bar: 10μm

