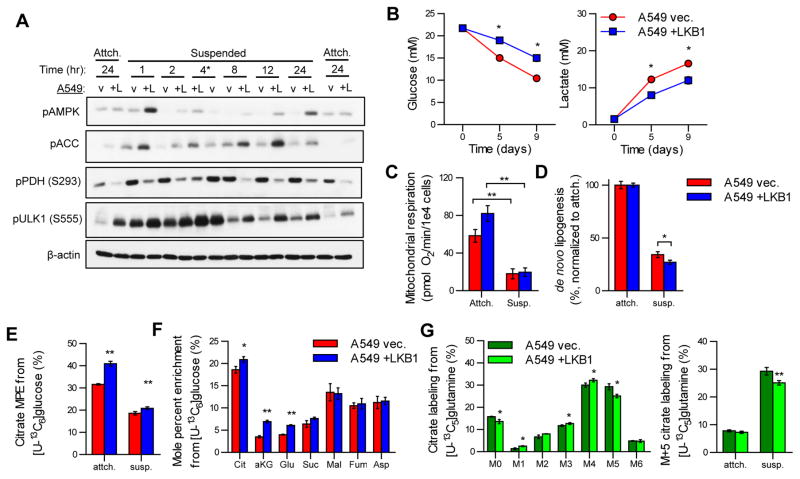
Fig 4. LKB1 coordinates metabolic reprogramming under anchorage-independent growth conditions.
(A) Immunoblot of phosphorylated AMPK (T172), phosphorylated ACC (S79), phosphorylated PDH (S293), phosphorylated ULK1 (S555), and β-actin on lysates from A549 vec. (v) and +LKB1 (+L) cells cultured in monolayer (Attch.) for 24 hours of in anchorage-independent conditions (Suspended) for 1, 2, 4, 8, 12, or 24 hours. A549 vec. and +LKB1 lysates switched at 4 hour time point indicated by *. (B) Glucose and lactate concentrations in spent media of A549 vec. and +LKB1 cells cultured in anchorage-independent conditions over 9 days. (C) Mitochondrial respiration of A549 vec. and +LKB1 cells cultured in attached or suspension conditions. (D) Percentage of fatty acids de novo synthesized in A549 vec. and +LKB1 cells cultured in attached or suspension conditions and normalized to attached values for each respective cell line. Values quantified using Isotopomer Spectral Analysis (ISA) on palmitate labeling from [U-13C6]glucose for 24 hours. (E) Mole percent enrichment (MPE) of citrate from [U-13C6]glucose in A549 vec. and +LKB1 cells cultured in attached or anchorage-independent conditions for 24 hours. (F) MPE of TCA intermediates from [U-13C6]glucose in A549 vec. and +LKB1 cells cultured in anchorage-independent conditions for 24 hours. (G) (left) Citrate labeling from [U-13C5]glutamine in A549 vec. and +LKB1 cells cultured in anchorage-independent conditions for 24 hours. (right) Citrate M+5 labeling from [U-13C5]glutamine in A549 vec. and +LKB1 cells cultured in attached or anchorage-independent conditions for 24 hours. All data (excluding B) are presented as mean ± s.d. of at least three replicates. Data presented in B is mean ± SEM of at least two independent experiments.

