
Figure 1.
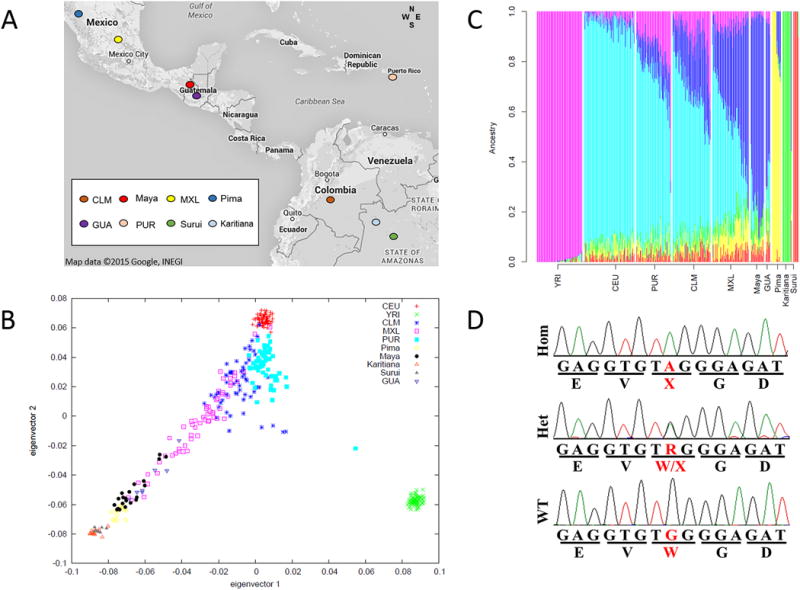
Geographic locations of the studied other populations (Modified from “Map data ©2015 Google, INEGI”) (A). Eigenvector plot analysis of the GUA samples and the compared populations. GUA samples that we studied are clustered closely and they overlap with HDGP Mayan samples (B). Ancestry analysis of the other populations and GUA samples represents identical genetic background between GUA and Mayan population (K=6). Each color represents an ancestral population (C) Electropherogram of the GJB2 c.131G>A pathogenic variant (D).