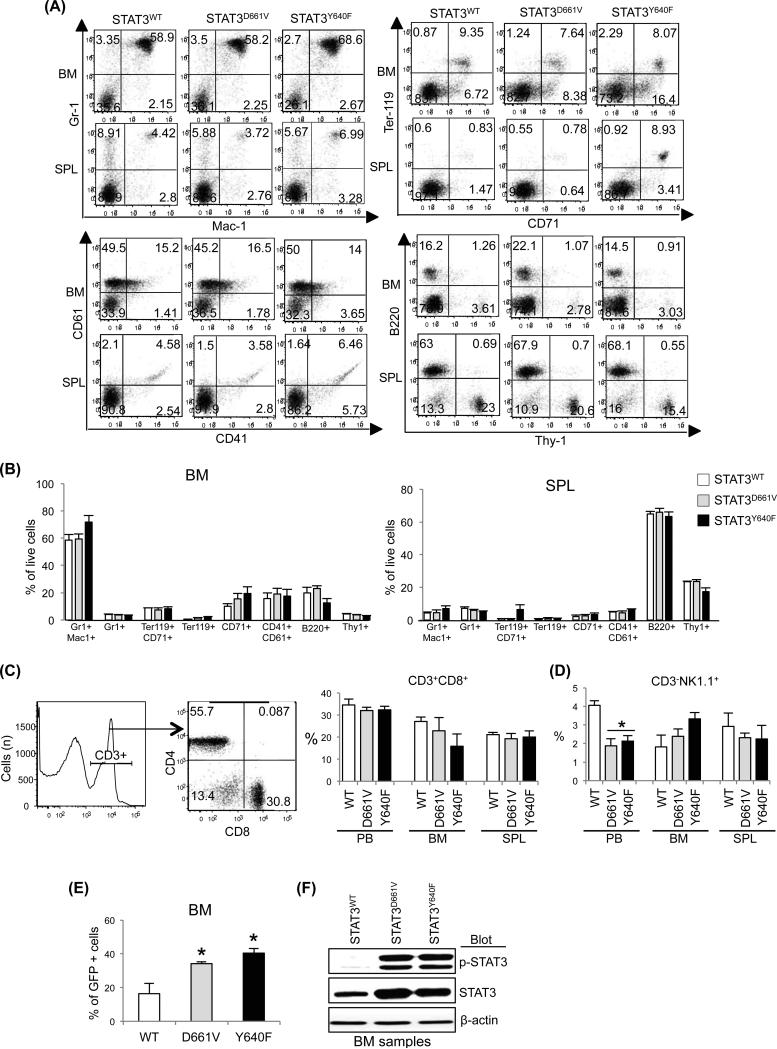
Fig 2.
Effects of STAT3 mutations on haematopoietic precursors. (A) Representative dot plots of flow cytometric analysis of myeloid (Gr-1+/Mac-1+), erythroid (Ter119+/CD71+), megakaryocytic (CD61+/CD41+), B-cell (B200+) and T-cell (Thy-1+) precursors in the bone marrow (BM) and spleens of transplanted animals expressing STAT3WT, STAT3D661V and STAT3Y640F at 16-20 weeks after bone marrow transplantation (BMT) are shown. (B) Percentages of myeloid (Gr-1+/Mac-1+), erythroid (Ter119+/CD71+), megakaryocytic (CD61+/CD41+), B-cell (B200+) and T-cell (Thy-1+) precursors in the BM and spleens (SPL) of transplanted animals expressing STAT3WT (n=4), STAT3D661V (n=4) and STAT3Y640F (n=4) are shown in bar graphs as mean ± SEM. (C) Flow cytometric analysis of CD3+CD8+ cells in the peripheral blood (PB), BM and spleens of transplanted animals expressing STAT3WT, STAT3D661V and STAT3Y640F at 16-20 weeks after BMT. (D) Percentages of CD3− natural killer cells (CD3−NK1.1+) in the peripheral blood (PB), BM and spleens of transplanted animals expressing STAT3WT, STAT3D661V and STAT3Y640F at 16-20 weeks after BMT are shown in histograms as mean ± SEM (n=4). (E) Flow cytometric analysis of GFP expression in the BM at 16-20 weeks after BMT. Data are shown in histograms as mean ± SEM (n=4; * indicates p<0.05 by Student's t-test). Note that significantly increased percentages of GFP+ cells in the BM of transplanted animals expressing STAT3D661V or STAT3Y640F compared with transplanted animals expressing STAT3WT. (F) Immunoblot analysis on total BM extracts shows constitutive phosphorylation of STAT3 in the BM of transplanted animals expressing STAT3D661V and STAT3Y640F mutants, suggesting that the STAT3 mutants were efficiently expressed and constitutively activated in the BM of the transplanted animals. β-actin was used as a loading control.

