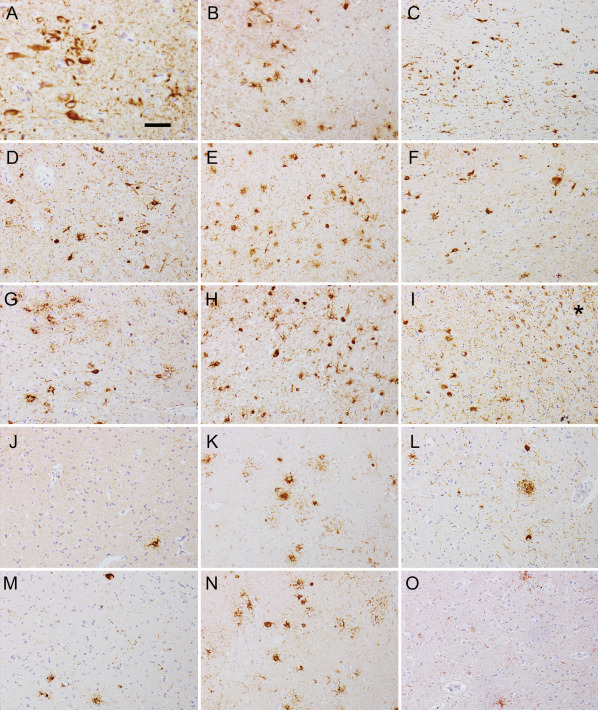
Figure 2.

Immunostaining for PHF‐1 in the CA1 (A–C), CA4 (D–F) subregions, amygdala (G–I), frontal cortex (J–L) and putamen (M–O) in cases 1 (A, D, G, J and M), 2 (B, E, H, K and N) and 3 (C, F, I, L and O). Note the numerous tau positive astrocytes in case 2 in all subregions, while less are seen in case 1 together with neurofibrillary tangles in the CA1 subregion. Case 3 exhibits neurofibrillary tangles and dystrophic neuritic plaques together with astrocytes in CA subregions and amygdala (* in image I indicates white matter in amygdala with thorn shaped astrocytes compatible with ARTAG). The bar in (A) represents 40 μm for (A) and 100 μm for (B)–(O).
