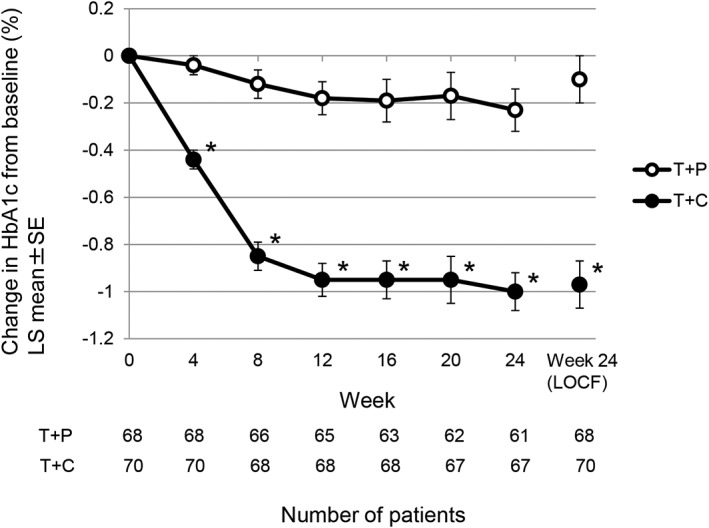
Figure 1.

Time course of change in HbA1c level from baseline in the 24‐week treatment period. Values are reported as LS means ± standard error. LS means by analysis of covariance (factor: treatment group; covariate: baseline value). *P < .001 for T + C vs T + P at all time points. HbA1c, glycated haemoglobin; LOCF, last observation carried forward; LS mean, least squares mean; T + C, teneligliptin + canagliflozin; T + P, teneligliptin + placebo
