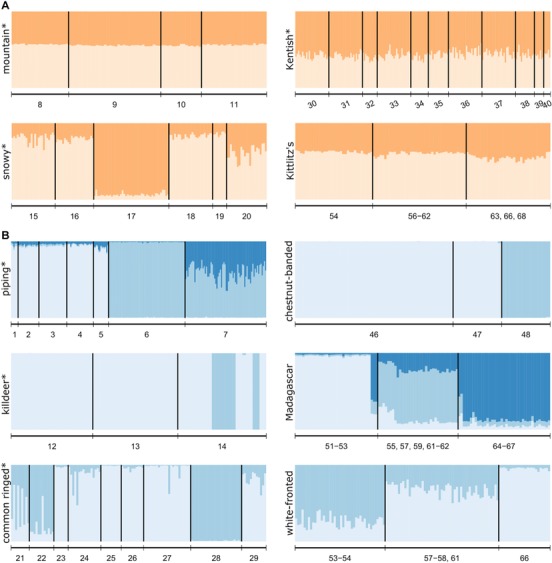
Figure 2.

Bayesian population clustering of Charadrius plovers according to genetic differentiation in (A) polygamous and (B) monogamous plover species. Migratory species are indicated by asterisk, otherwise a species is an all year resident. Each vertical line represents an individual, colours represent the membership proportion to a given genetic cluster. Models with two or three clusters are presented. See table 1 for site ID number for each species.
