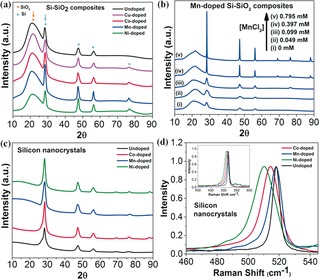
Figure 2.

X‐ray diffraction patterns of the materials grown at 1100 °C. a) Si–SiO2 composites with and without dopant, b) Mn‐doped Si–SiO2 composites obtained with different starting concentrations of MnCl2 and c) free‐standing doped and undoped SiNCs. d) Raman spectra of the free‐standing SiNCs grown from Si–SiO2 composites at 1100 °C (inset: full Raman spectra).
