Figure 3.

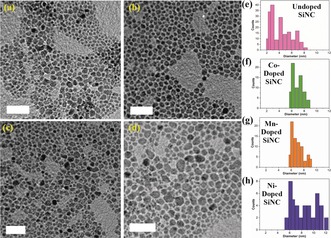
TEM images of a) undoped, b) Co‐doped, c) Mn‐doped, and d) Ni‐doped SiNCs, grown at 1100 °C (scale bars=50 nm). e–h) Size‐distribution histograms of the corresponding doped and undoped SiNCs.

TEM images of a) undoped, b) Co‐doped, c) Mn‐doped, and d) Ni‐doped SiNCs, grown at 1100 °C (scale bars=50 nm). e–h) Size‐distribution histograms of the corresponding doped and undoped SiNCs.