Figure 5.

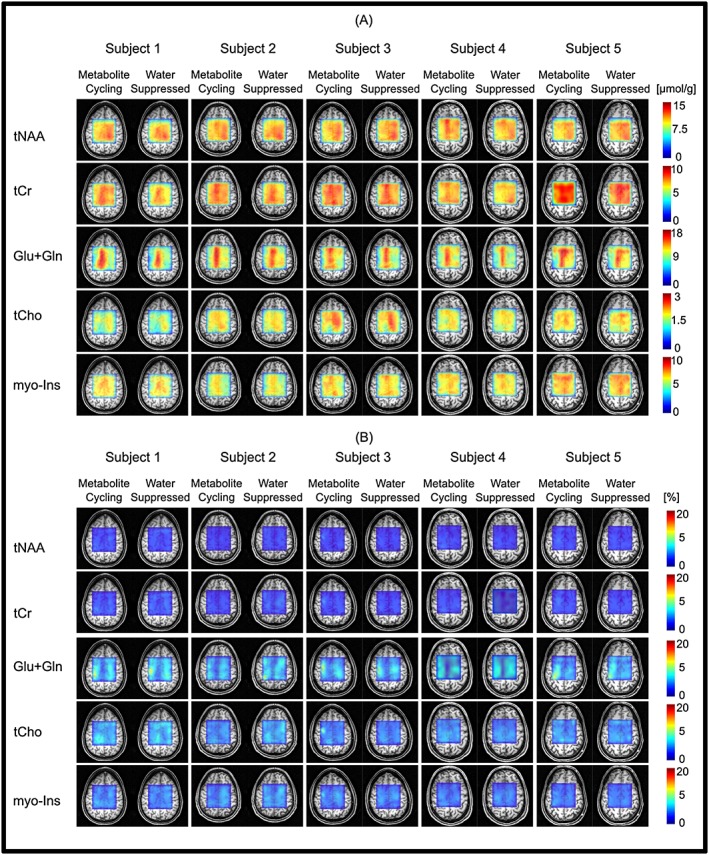
Metabolite and CRLB distribution maps obtained from all subjects. Absolute metabolite concentration (A) and CRLB (B) maps of tNAA, tCr, Glu + Gln, tCho and myo‐Ins overlaid on an anatomical image

Metabolite and CRLB distribution maps obtained from all subjects. Absolute metabolite concentration (A) and CRLB (B) maps of tNAA, tCr, Glu + Gln, tCho and myo‐Ins overlaid on an anatomical image