
Figure 7.
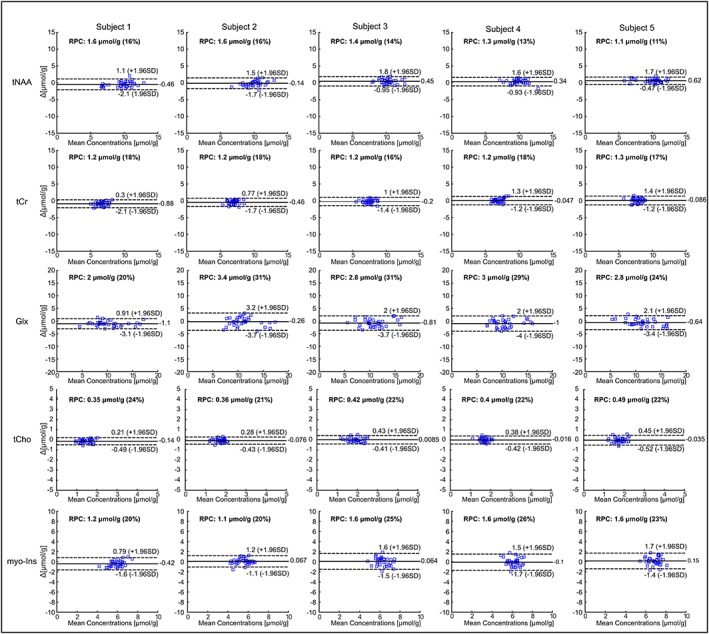
Bland–Altman analysis of in vivo measurements. Bland–Altman plots indicate the limits of agreement between metabolite concentrations quantified from non‐water‐suppressed metabolite‐cycling and water‐suppressed MRSI from each subject. The y‐axis shows the difference between the two techniques for each localized voxel (water suppressed − non‐water‐suppressed, Δ) and the x‐axis represents the average of these measures ((water suppressed + non‐water‐suppressed)/2, mean). The dotted lines represent ±1.96 SD with the limits of agreement. The solid line represents the mean bias