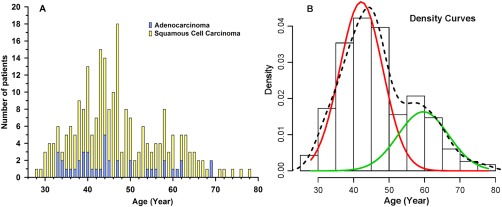
Figure 1.

(A) Age distribution of adenocarcinoma and squamous cell carcinoma in 232 cervical cancer patients. (B) Density curves (histogram representing the percent of patients per unit age) of the incidence of cervical cancer by 5‐year age groups computed using the EM algorithm in the R package showing 2 clusters fitted with 2 curves with a first peak at younger age of 42.5 years (red curve) and a second peak at older age of 60.8 years (green curve). The dotted line represents the overall curve fitting.
