Figure 2.

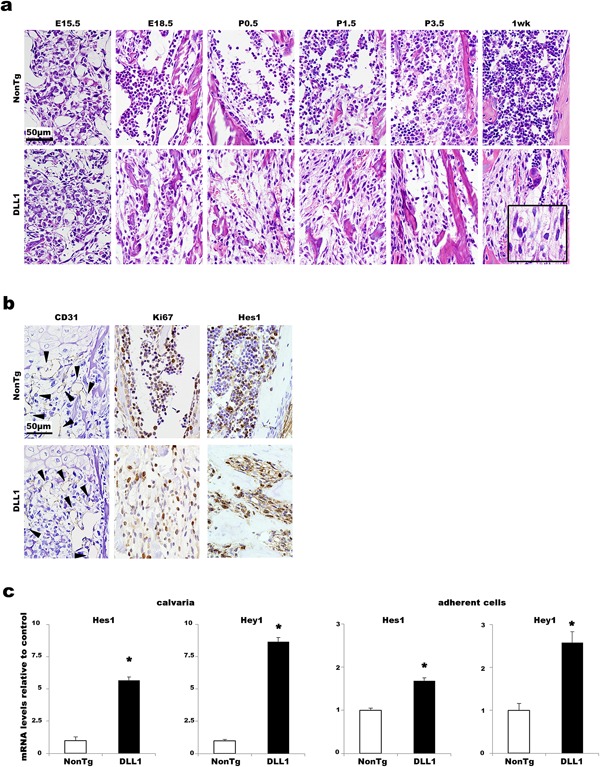
Effects of osteoblast‐specific DLL1 expression in BM histomorphology. (a) Representative H&E staining of hind limbs of non‐transgenic and DLL1 littermates between E15.5 and 1 week. Beginning at E18.5, fibroblast‐like cells are evident in DLL1 specimens. An insert at 1 week of DLL1 image shows higher magnification. Two to six littermate pairs were analyzed at each time point. At least two slides were stained for each sample. (b) Representative images of immunostaining for CD31 at E15.5 and for Ki67 and Hes1 at P5.5. Note that numerous Ki67‐ and Hes1‐positive fibroblastic cells are evident in DLL1 BM, whereas in the non‐transgenic littermate, the majority of Ki67‐ and Hes1‐positive cells appear to be round hematopoietic cells. Arrowheads indicate CD31 positive endothelial cells of vasculature. Two littermate pairs were analyzed at each time point. At least two independent staining procedures were performed for each antibody. (c) Representative quantitative‐PCR analyses for Hes1 and Hey1 expression in calvaria and adherent BM cells. RNA purified from calvaria (n = 7) and adherent BM cells (n = 3) obtained from non‐transgenic and DLL1 littermates was analyzed. All analyses were performed in quadruplicate wells. Gene expression levels are shown relative to non‐transgenic controls. Error bars, mean ± SD; *P < 0.05.
