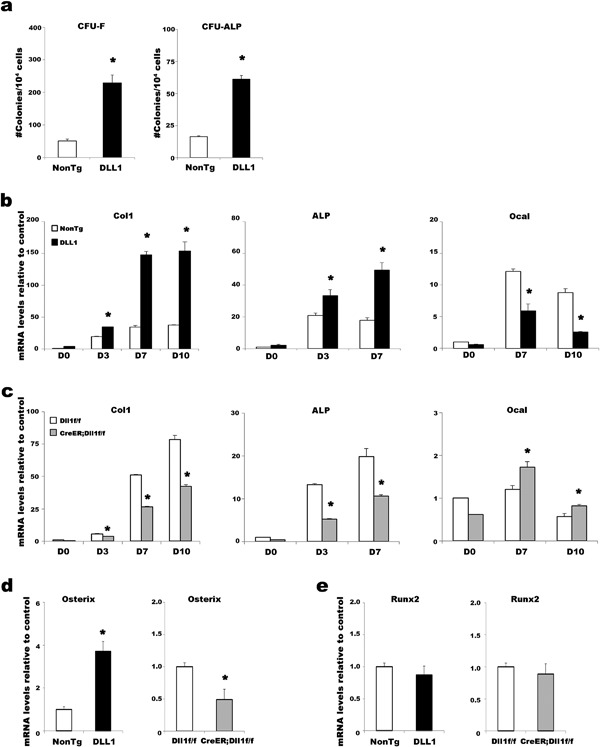
Figure 4.

Roles of DLL1 in osteoblast differentiation in vitro. (a) CFU assays for quantifying fibroblast and osteoblast colonies formed from the BM cells of non‐transgenic and DLL1 mice. Representative data from seven independent experiments are shown. All experiments were performed in triplicate wells. Error bars, mean ± SD; *P < 0.05. (b and c) Time course analyses of the expression levels of osteoblast markers during cultures of DLL1 and Dll1‐floxed mice, as indicated. Col1: Collagen 1, ALP: Alkaline phosphatase, Ocal: Osteocalcin. Osterix (d) and Runx2 (e) expression in MSC‐enriched BM cells. In (b–e), representative data from three independent experiments are shown. All analyses were performed in triplicate wells. Bars in each graph represent relative levels of mRNA compared to non‐transgenic controls. Error bars, mean ± SD; *P < 0.05.
