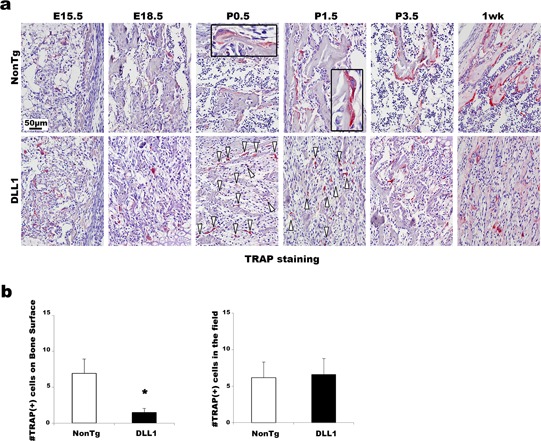
Figure 5.

Effects of osteoblast‐specific DLL1 expression in osteoclast differentiation in vivo. (a) Representative TRAP staining pictures of BM specimens from E15.5 to 1 week. Arrowheads in DLL1 images indicate osteoclasts. Inserts in non‐transgenic images are higher magnification. Two littermate pairs were analyzed at each time point. At least two slides were stained for each sample. (b) Microscopic quantification of the number of TRAP(+) cells on the bone surface and in the entire field at 1‐week‐old samples. Seven random fields were counted for each sample. Pooled data from two independent littermate pairs were used for analyses. Error bars, mean ± SD; *P < 0.05.
