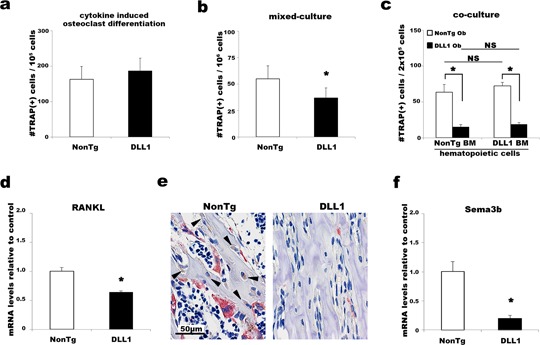
Figure 6.

Effects of osteoblast‐specific DLL1 expression in osteoclast differentiation in vitro. (a) The numbers of TRAP(+) osteoclasts formed in cytokine‐induced culture, (b) mixed culture, and (c) osteoblast‐osteoclast co‐culture in vitro. (a and b) Representative data from six independent experiments are shown. (c) Representative data from three independent experiments using calvarial osteoblasts obtained from a total of three non‐transgenic and six DLL1 littermates. Ob, osteoblasts. Experiments were performed at least in triplicate wells. Error bars, mean ± SD; *P < 0.05. Quantitative PCR analyses of Rankl (d) and Semaphorin 3B (f) expression in non‐transgenic and DLL1 osteoclast culture. Representative data from five independent experiments are shown. Analyses were performed at least in triplicate wells. Error bars, mean ± SD; *P < 0.05. (e) Immunostaining of 4‐week‐old mice. BM specimens were stained for RANKL and then for TRAP. Arrowheads indicate RANKL‐positive, bone‐lining, and matrix‐embedded osteoblasts. Four independent littermate pairs at the ages of 2–4 weeks were stained.
