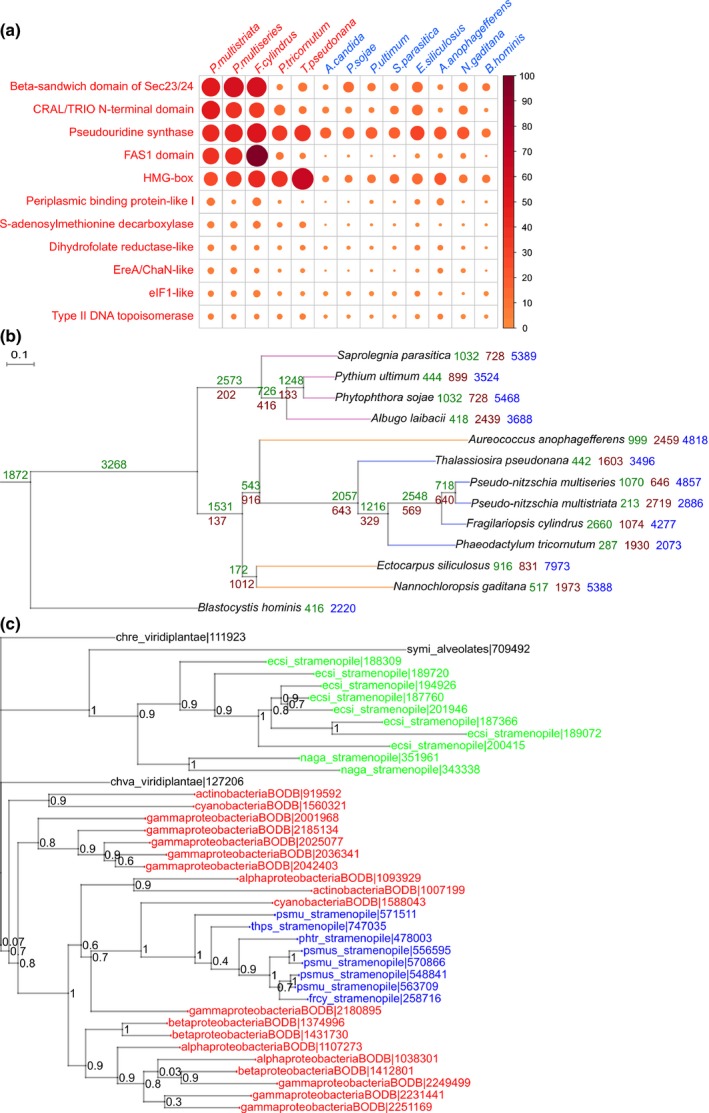
Figure 3.

Evolution of gene families in diatoms. (a) Expansion of gene families within diatoms. Each column represents a stramenopile species and each row represents a given gene family showing expansion within diatoms as compared with other Stramenopiles. Names of diatom species are given in red, whereas names of other Stramenopiles are given in blue. The colour intensity and size of the circles are proportional to the number of genes falling under the given gene family. (b) A species tree of Stramenopiles derived using a maximum likelihood approach, built using 85 genes showing one‐to‐one orthology among the selected species. The selected genes include genes with a wide range of functions. Branch lengths are drawn to scale. At each branch point, the number of gene family gains and losses is indicated in green and brown, respectively. The number of orphans present in each organism is shown in blue. (c) Phylogenetic tree for a cluster containing proteins annotated with an uncharacterized cystatin‐like domain, conserved in bacteria. The tree topology depicts a potential horizontal gene transfer event which led to the introduction of the gene within diatoms. The regions coloured red, blue and green represent bacteria, diatoms and other Stramenopiles, respectively. Species codes used in the tree: ecsi, Ectocarpus siliculosus; naga, Nannochloropsis gaditana; symi, Symbiodinium minutum; psmu, Pseudo‐nitzschia multistriata; psmus, Pseudo‐nitzschia multiseries; frcy, Fragilariopsis cylindrus; phtr, Phaeodactylum tricornutum; thps, Thalassiosira pseudonana; chre, Chlamydomonas reinhardtii; chva, Chlorella variabilis; BODB suffix is used for all bacterial species. For the correspondence between protein IDs used in this tree and GenBank IDs, see Supporting Information Methods S1.
