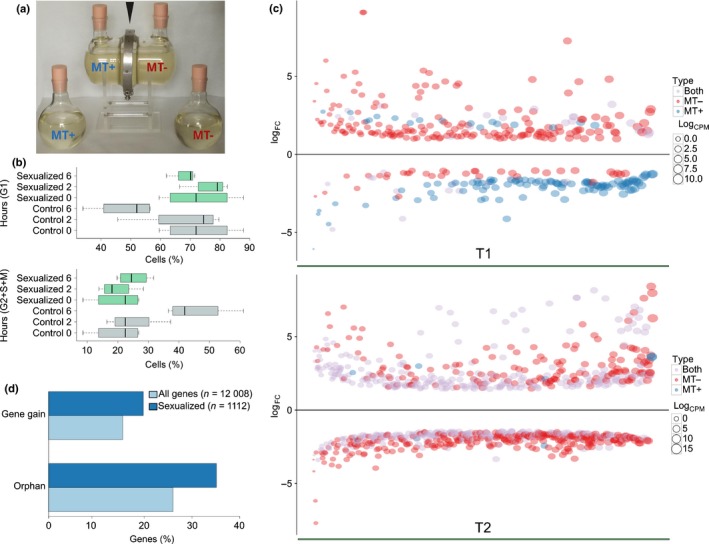
Figure 4.

Cell cycle and gene expression changes in the early stages of sexual reproduction. (a) Co‐culture glass apparatus containing cultures of opposite mating type (MT) separated by a membrane held by a metal ring (black arrowhead), and control bottles containing each of the two MTs. (b) Cell cycle phases of MT+ and MT– control (grey) and sexualized (green) samples represented by the relative percentage of cells in G1 (upper) and S + G2 + M (lower) phases, at the beginning of the experiment (0) and 2 and 6 h later. Whiskers in the boxplot extend to ± 1.5 × interquartile range (IQR). (c) Plot showing the logFC (fold change) (y‐axis) of genes differentially expressed, ordered according to the logCPM (counts per million) on the x‐axis. (d) Percentage of orphan genes and gene gains in the set of genes differentially expressed at the onset of the sexual phase in Pseudo‐nitzschia multistriata compared with the percentages of the same classes in the entire gene set.
