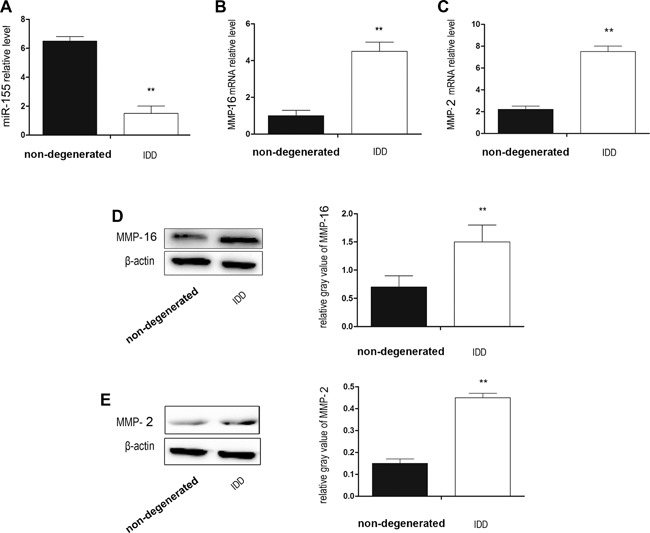
Figure 1.

Clinical relationship between miR‐155, MMP‐16, MMP‐2, and IDD. (A) miR‐155 relative expression by real time‐PCR. Expression of miR‐155 in the IDD group was obviously lower than that in the non‐degenerated group. (B) MMP‐16 mRNA relative expression by real time‐PCR. MMP‐16 mRNA expression in the IDD group was obviously higher than that in the non‐degenerated group. (C) MMP‐2 mRNA relative expression by real time‐PCR. MMP‐2 mRNA expression in the IDD group was obviously higher than that in the non‐degenerated group. (D) Western blotting analysis of MMP‐16. The expression of MMP‐16 proteins in the IDD group was obviously higher than that in the non‐degenerated group. (E) Western blotting analysis of MMP‐2. The expression of MMP‐2 proteins in the IDD group was obviously higher than that in the non‐degenerated group. The difference between the groups was statistically significant. n = 5 in the non‐degenerated group, n = 10 in the IDD group. Data are means ± SD. **p < 0.01.
