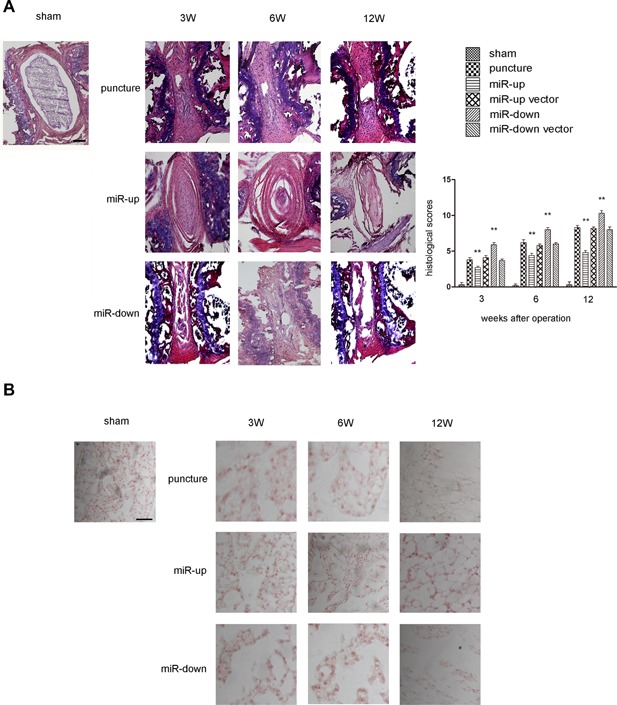
Figure 5.

Assessment of the impact on histological score. (A) Histological images of HE staining and histological scores for operated discs in C57 mice. The histological scores for the puncture group, miR‐up group, and miR‐down group continued to increase with time at 3, 6, and 12 weeks after surgery. The histological score in the miR‐up group was significantly lower than that in the miR‐down group at 3, 6, and 12 weeks. No statistical differences in histological score were noted between the puncture group, miR‐up vector group and miR‐down vector group at 3, 6, and 12 weeks after surgery. n = 5 per group. Data are means ± SD. Scale bars, 200 µm. (B) Safranin‐O staining. The expression of proteoglycan in the puncture group, miR‐up group and miR‐down group continued to increase with time at 3, 6, 12 weeks after surgery. The expression of proteoglycan in the miR‐up group was significantly lower than that in the miR‐down group at 3, 6, and 12 weeks. No statistical differences in expression of proteoglycan were noted between the puncture group, miR‐up vector group and miR‐down vector group at 3, 6, and 12 weeks after surgery. n = 5 per group. Data are means ± SD. Scale bars, 200 µm.
