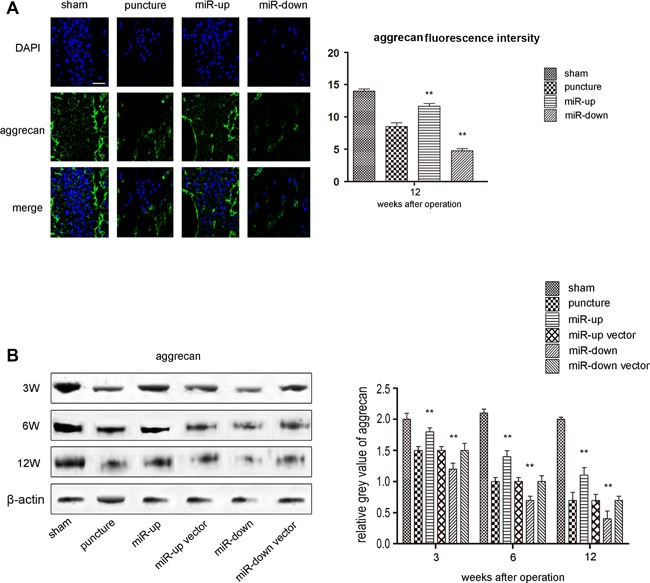
Figure 6.

Assessment of the impact on aggrecan. (A) IHC for aggrecan in each group shows the up‐regulation of miR‐155 can enhance the expression of aggrecan while the down‐regulation of miR‐155 can inhibit the expression at 12 weeks after surgery. Scale bars, 40 µm. n = 5 per group. Data are means ± SD. **p < 0.01. (B) Western blot analysis shows that the expression of aggrecan in each punctured group continued to decrease with time at 3, 6, and 12 weeks after surgery compared with the sham group. The signal of aggrecan in the miR‐up group was higher than that in the puncture group at 3, 6, and 12 weeks, while the signal in the miR‐down group was lower. The signals in the puncture group, miR‐up vector group, and miR‐down vector group were at the same level. n = 5 per group. Data are means ± SD. **p < 0.01.
