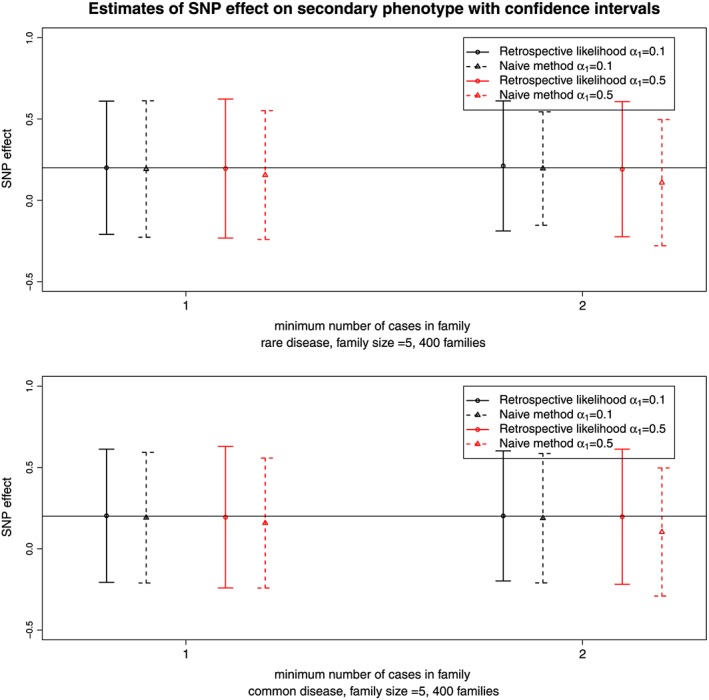
Figure 3.

Estimates and 95% confidence intervals for the single‐nucleotide polymorphism (SNP) effect on the secondary phenotype for the retrospective likelihood approach and the naive method. Results are obtained from 500 simulated datasets of 400 sibships for two ascertainment schedules. The top and bottom panel correspond to a rare or common primary phenotype with a prevalence around 1% and 5%, respectively. In black and red are represented results for small (α 1=0.1) and large (α 1=0.5) effect sizes of the SNP on the primary phenotype, respectively. The horizontal line corresponds to the true SNP effect on the secondary phenotype.
