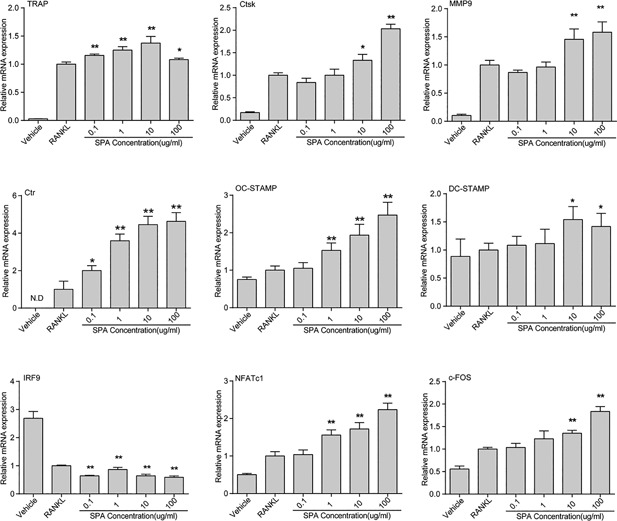
Figure 3.

Relative mRNA expression during SPA treatment RAW264.7 cells were seeded (2 × 10⁴ per well) into 24‐well plates and were cultured with different dosages of SPA for 24 and 72 hr with RANKL (50 ng/ml) and M‐CSF (50 ng/ml). TRAP, Ctsk, MMP9, Ctr, OC‐STAMP, DC‐STAMP, and IRF9 was detected at 72 hr. NFATc1 and c‐FOS was analyzed at 24 hr. The data in the figures represent mean ± SD. Significant differences between the treatment and control groups are indicated as *(p < 0.05) or **(p < 0.01)
