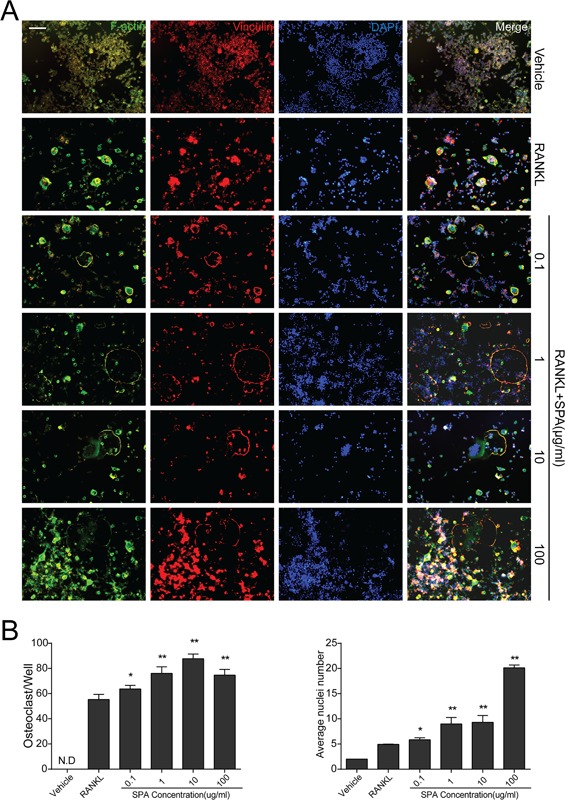
Figure 4.

SPA promotes RANKL‐induced osteoclast fusion. (A) Representative images of focal and adhesion staining (FAK) of RAW264.7 cells treated with different concentrations of SPA treatments for 72 hr with RANKL (50 ng/ml) and M‐CSF (50 ng/ml). Experimental groups were the same as before. Scale bar represents 100 μm. (B) Quantification of osteoclasts (nuclei ≥ 3) and average nuclei number in each group (96‐well plate). The data in the figures represent mean ± SD. Significant differences between the treatment and control groups are indicated as *(p < 0.05) or **(p < 0.01)
