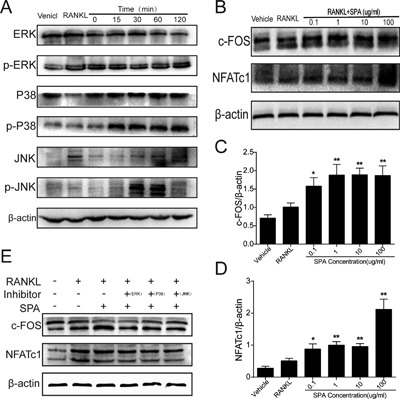
Figure 6.

Relative proteins expression during SPA treatment (A) RAW264.7 cells were stimulated with 100 μg/ml SPA in presence of RANKL (50 ng/ml) and M‐CSF (50 ng/ml) for various time periods. Representative blots of phosphorylated or nonphosphorylated forms of MAPKs including ERK, JNK, and p38 are shown. (B) RAW264.7 cells were treated with different concentration of SPA (0, 0. 1, 1, 10, 100 μg/ml) in presence of RANKL (50 ng/ml) and M‐CSF (50 ng/ml) for 72 hr. Western blots were performed to analyze the protein expression of NFATc1 and c‐FOS. (C) and (D) Quantification of NFATc1 and c‐FOS protein levels normalized by β‐actin. (E) The protein expression of NFATc1 and c‐FOS when phosphorylation inhibitors of ERK, JNK, and P38 MAPK were administered. The data in the figures represent mean ± SD. Significant differences between the treatment and control groups are indicated as *(p < 0.05) or **(p < 0.01)
