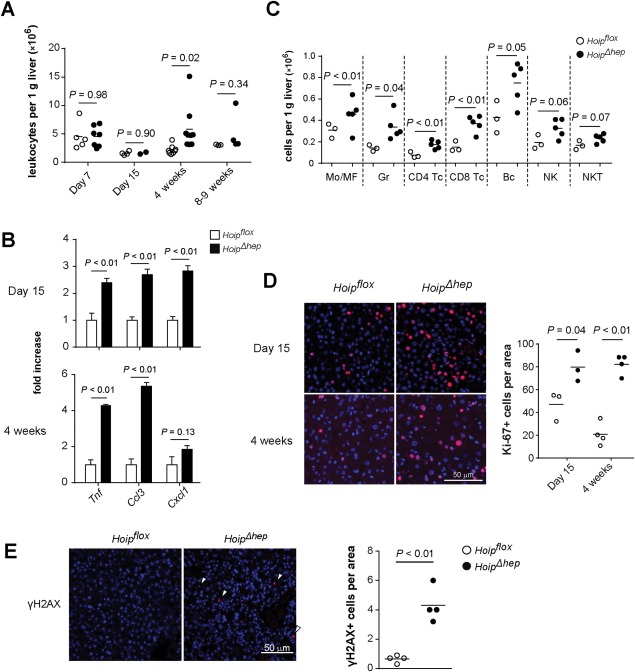
Figure 2.

Inflammation accompanied by DNA damage emerges in HOIP‐deleted livers. (A) Hepatic CD45+ cell count per gram of Hoipflox (open circles) and HoipΔhep mice (closed circles) at the indicated ages. (B) Relative quantification of the transcript levels of Tnf, Ccl3, and (Cxcl1) in Hoipflox and HoipΔhep livers (n = 4 each). Levels of transcripts were normalized to those of Hoipflox livers. (C) Liver cells from Hoipflox and HoipΔhep mice at 4 weeks of age were stained, and the numbers of hepatic immune subpopulations were quantified by flow cytometry. (D) Ki‐67 staining (red) of liver sections from Hoipflox and HoipΔhep mice at 4 weeks of age. The dot plot shows the quantification of Ki‐67+ cells per optical area. (E) γH2AX staining (red) of liver sections from Hoipflox and HoipΔhep mice at 4 weeks of age. The dot plots show the quantification of γH2AX+ cells per optical area. Unpaired two‐tailed t test was employed for statistical analysis. Abbreviations: Bc, B220+ cells; CD4 Tc, CD3+ CD4+ cells; CD8 Tc, CD3+ CD8+ cells; Gr, Ly6G+ cells; Mo/MF, F4/80+ cells; NK, CD3− NK1.1+ natural killer cells; NKT, CD3+ NK1.1+ natural killer T cells.
