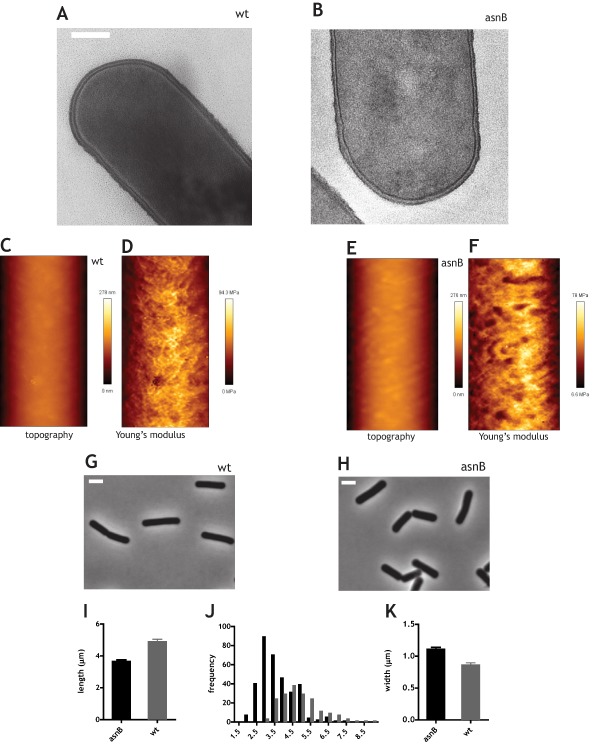
Figure 3.

Ultrastructure, mechanics, and morphology of ΔasnB mutant cells grown with excess Mg2+. Cells were grown to mid‐exponential phase in LB medium supplemented with 25 mM Mg2+. A. and B. Transmission electron micrographs of wild‐type (A) and ΔasnB (B) cells. Scale bar is 200 nm. C–F. Atomic force microscopy imaging of the surface topography (C and E) and of rigidity measurement (D and F) of wild‐type (C and D) and ΔasnB mutant cells (E and F). Scale of height is indicated to the right of panels C and E and the scale of Young's modulus is indicated on the right of panels D and E. Scan size was 0.683 by 1.711 µm. G and H. Phase‐contrast micrographs of wild‐type (G) and ΔasnB cells (H). Scale bar is 2 μm. I. Bar graph of average cell length of wild‐type and ΔasnB cells. 95% confidence intervals are shown (> 300 cells were measured). J. Histogram of cell lengths for wild‐type and ΔasnB mutant cells. K. Bar graph of width of wild‐type and ΔasnB mutant cells. 95% confidence intervals are shown (> 300 cells were measured).
