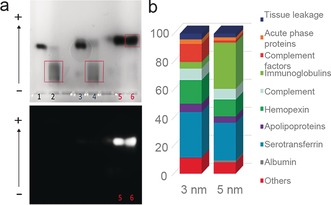
Figure 2.

a) 1 % Agarose gel‐assay in a native buffer. The numbered lanes refer to 5 nm GNP‐PEG‐COOH in PBS (1) and in HP (2), 3 nm GNP‐PEG‐COOH in PBS (3) and in HP (4), 2 nm GNP‐PEG‐COOH in PBS (5) and in HP (6). Below, the image captured by fluorescence detection mode. Note: only 2 nm GNP‐PEG‐COOH exhibit fluorescence. b) Mass spectrometry analysis of 3 nm and 5 nm GNP‐PEG‐COOH corona complexes isolated by agarose gel electrophoresis.
