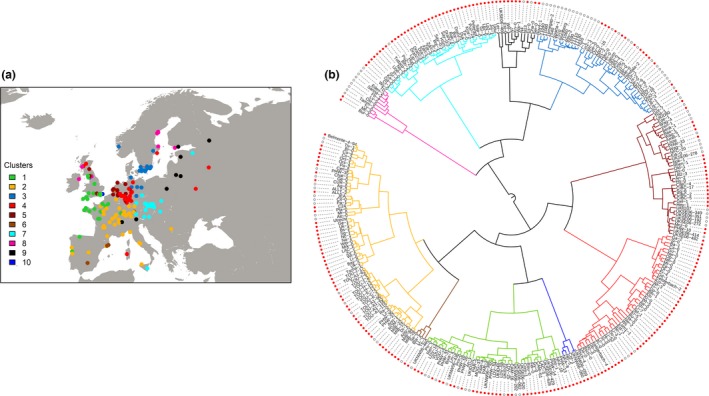
Figure 1.

Population structure in the European accessions from the Hapmap population. Clusters of accessions were generated based on kinship matrix. (a) Geographic distribution of genetic clusters is shown in colours. (b) Dendrogram shows the relationship among accessions. Branch colours correspond to the colours in the map. Life cycle strategy is indicated by red circles (summer annuals) and white circles (winter annuals). Dendrogram was generated with itol (http://itol.embl.de/index.shtml).
