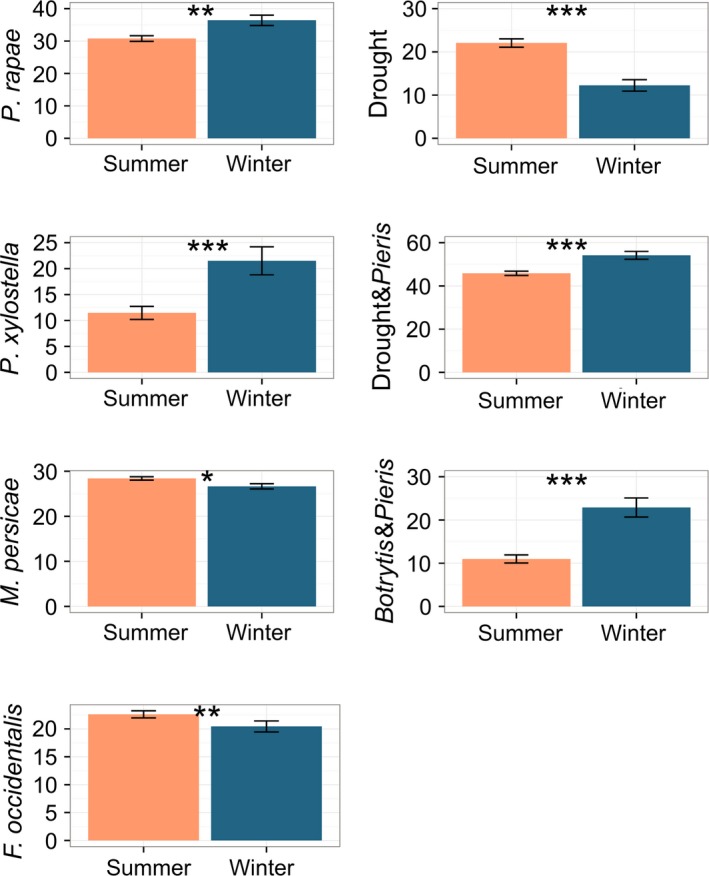
Figure 2.

Stress responses of A. thaliana accessions belonging to either winter annual or summer annual life cycle strategies. Accessions that required vernalization for flowering were classified winter annuals (blue, n = 89); the rest were classified summer annuals (orange, n = 219). Bars show mean value ± SE. Stress responses to P. rapae caterpillars, P. xylostella caterpillars, Drought, Drought&Pieris and Botrytis&Pieris are represented by the percentage of biomass reduction in A. thaliana in response to each stress. Response to M. persicae is represented by the number of aphids produced. Response to F. occidentalis thrips is represented by the amount of feeding damage in mm2. Bayesian P‐values are indicated as *P ≤ 0.05, **P < 0.01, ***P < 0.001.
