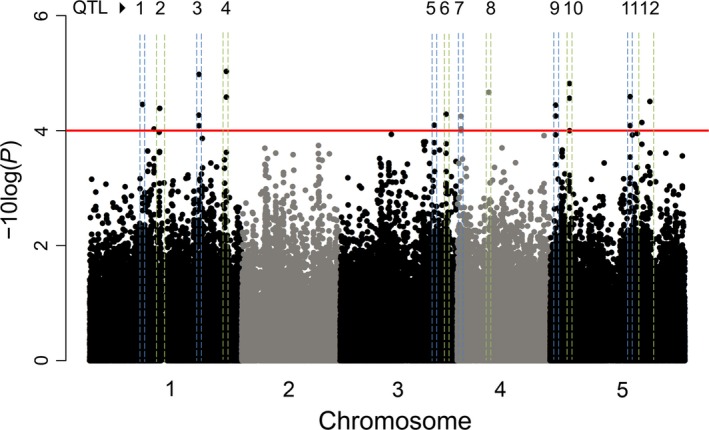
Figure 4.

Multi‐trait GWA analysis. Red line indicates an arbitrary threshold set at −log10(P) ≥ 4 as described in the Methods section for detecting significant associations. QTL regions are indicated with numbers. Detailed information about each QTL is presented in Data S2 (Supporting information).
