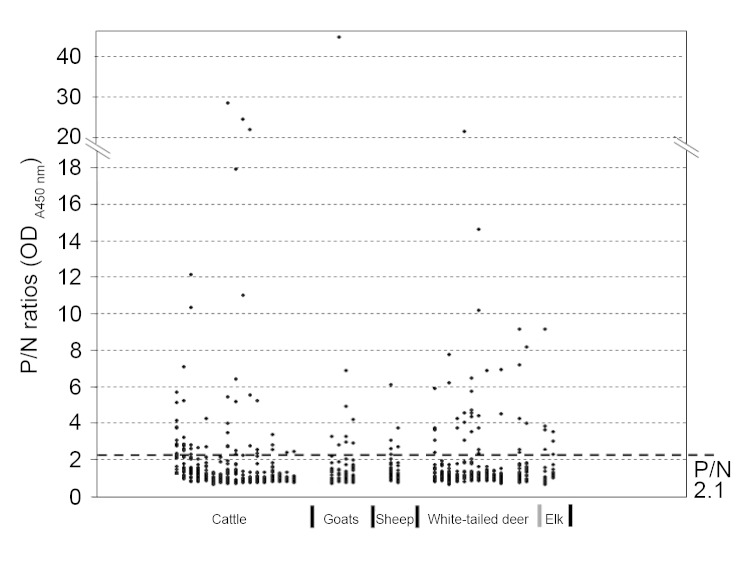
Figure 1.
Distribution of positivity (P)/negativity (N) ratios among various animal species tested for antibodies against severe fever with thrombocytopenia syndrome virus nucleoprotein, Minnesota, USA, 2012. N = mean + 3 × SD of optical density (OD)450nm values of negative controls; P = OD450nm value of a test sample.

