
Figure 4.
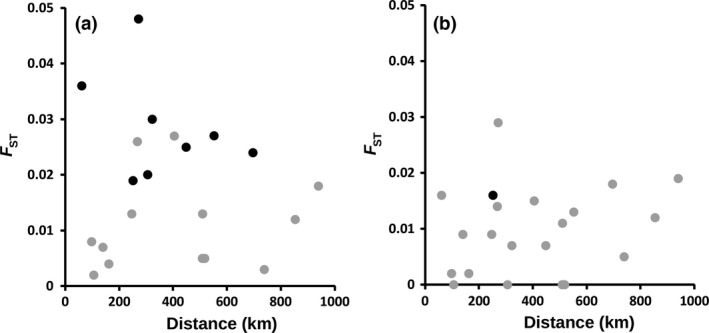
Scatterplot of FST genetic differentiation in all pairwise comparisons of eight local Mauritanian Plasmodium falciparum populations sampled vs. the geographical distance between them. (a) FST values calculated with the inclusion of all 203 infection samples, and (b) FST values calculated with 182 samples following removal of near identical genotypes within sites (randomly retaining one of the samples matching at 7 or more of 10 loci). Although significant FST values (black points show uncorrected P values of <0.01) were observed for 8 pairs of sites when all isolates were considered, only one (comparing Aioun and Nema) remained following removal of replicate near identical infection samples. All FST values for all pairs of sites, as well as values of another differentiation index (Jost's D est), are listed in Table S4 (Supporting information).